Figure 1: Insurer Participation on ACA Marketplaces, 2018-2019
Rachel Fehr, Cynthia Cox, and Larry Levitt
Published: Nov 14, 2018 - The Henry J. Kaiser Family Foundation
Since the Affordable Care Act health insurance marketplaces opened in 2014, there have been a number of changes in insurer participation as companies entered and exited states and also changed their footprint within states.
In 2014, there were an average of 5.0 insurers participating in each state’s ACA marketplace, ranging from one company in New Hampshire and West Virginia to 16 companies in New York. (Note that we consider affiliated insurers serving the same areas as one insurer.) 2015 saw a net increase in insurer participation, with an average of 6.0 insurers per state, ranging from one in West Virginia to 16 in New York. In 2016, insurer participation changed in a number of states due to a combination of some new entrants and the failure of a number of CO-OP plans. In 2016, the average number of companies per state was 5.6, ranging from one in Wyoming to 16 in Texas and Wisconsin. In 2017, insurance company losses led to a number of high profile exits from the market. The average number of companies per state in 2017 was 4.3, ranging from one company in Alabama, Alaska, Oklahoma, South Carolina and Wyoming to 15 companies in Wisconsin.
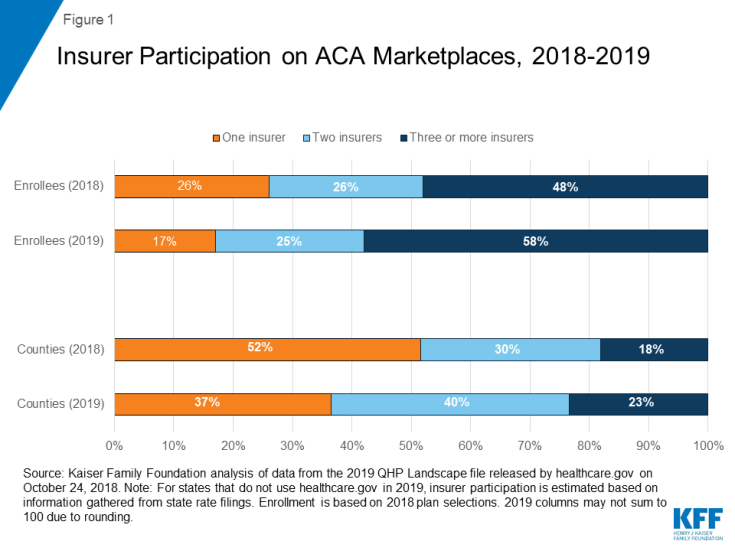
Although insurance company profits improved during 2017, a number of insurers exited the market or reduced their service area going in to 2018, likely driven in part by legislative and regulatory uncertainty. The average number of companies per state in 2018 was 3.5, ranging from one company in eight states (Alaska, Delaware, Iowa, Mississippi, Nebraska, Oklahoma, South Carolina, and Wyoming) to more than 10 insurers in three states (Wisconsin, California, and New York). In 2018, 48% of enrollees (living in about 18% of counties) had a choice of three or more insurers. Despite concerns earlier in the year, there were no counties without at least one insurer in 2018.
Insurance company margins have continued to improve during 2018, and a number of insurers entered the market or expanded their service area for 2019. The average number of companies per state in 2019 is 4.0, ranging from one company in five states (Alaska, Delaware, Mississippi, Nebraska, and Wyoming) to more than 10 companies in three states (California, New York and Wisconsin). In 2019, 58% of enrollees (living in about 23% of counties) have a choice of three or more insurers, up from 48% of enrollees in 2018.
Although there are an average of 4.0 insurance companies per state, many insurers do not participate statewide. Insurer participation varies greatly within states, and rural areas tend to have fewer insurers. On average, metro-area counties have 2.3 insurers participating in 2019, compared to 1.8 insurers in non-metro counties. In 2018, 87% of enrollees lived in metro counties.
The map and chart below show how insurer participation has changed from 2014 – 2019 in every county in the U.S. Data for this map are available for download.
Figure 1: Insurer Participation on ACA Marketplaces, 2018-2019
Going into 2019, 608 counties are gaining at least one insurer, while only five counties nationwide will lose an insurer. The map below shows net insurer entrances and exits for 2019 by county.
There are a number of areas in the country with just one exchange insurer. In 2019, about 17% of enrollees (living in 37% of counties) have access to just one insurer on the marketplace (down from 26% of enrollees living in 52% of counties in 2018). Often, when there is only one insurer participating on the exchange, that company is a Blue Cross Blue Shield or Anthem plan. Before the ACA, state individual markets were often dominated by a single Blue Cross Blue Shield plan.
Insurer participation on the ACA Marketplaces will improve in 2019, with an average of 4.0 insurers participating per state, up from 3.5 in 2018. The share of Marketplace enrollees with only one insurer option (17%) will be the lowest since 2016. For the first time since 2015, there are more companies entering into markets or expanding their footprints within states than there are withdrawals. Nonetheless, the market overall continues to have lower insurer participation than in the early years of ACA implementation.
Going into 2019, insurers in the individual market, including both on- and off-exchange, have factored in higher premiums due to repeal of the individual mandate penalty and expansion of short-term plans. While these legislative and policy changes have had an upward effect on 2019 premiums, they do not appear to have discouraged insurer participation on-exchange. Marketplace premium tax credits cushion enrollees from the upward effects these legislative and policy changes have had on premiums, but insurers will be closely watching the extent to which healthy people – particularly those not eligible for subsidies – leave the ACA-compliant individual insurance market, where there have already been declines in enrollment as premiums have increased in recent years.
Most insurers will continue to load the costs associated with the loss of federal cost-sharing reduction payments onto only silver plans in 2019 (a practice known as “silver loading”). Their ability to do so has increased the amount of financial assistance many enrollees receive (as subsidies are tied to the cost of silver plans) and therefore diminished much of the destabilizing effect the loss of these payments would have had on the market. However, if state or federal regulators make changes to insurers’ ability to “silver load,” the market would be disrupted and some insurers might reconsider their participation.
| Table 1: Total Number of Insurers by State, 2014 – 20192 | ||||||
| State | 2014 | 2015 | 2016 | 2017 | 2018 | 2019 |
| Alabama | 2 | 3 | 3 | 1 | 2 | 2 |
| Alaska | 2 | 2 | 2 | 1 | 1 | 1 |
| Arizona | 8 | 11 | 8 | 2 | 2 | 5 |
| Arkansas | 3 | 3 | 4 | 3 | 3 | 3 |
| California | 11 | 10 | 12 | 11 | 11 | 11 |
| Colorado | 10 | 10 | 8 | 7 | 7 | 7 |
| Connecticut | 3 | 4 | 4 | 2 | 2 | 2 |
| Delaware | 2 | 2 | 2 | 2 | 1 | 1 |
| DC | 3 | 3 | 2 | 2 | 2 | 2 |
| Florida | 8 | 10 | 7 | 5 | 4 | 5 |
| Georgia | 5 | 9 | 8 | 5 | 4 | 4 |
| Hawaii | 2 | 2 | 2 | 2 | 2 | 2 |
| Idaho | 4 | 5 | 5 | 5 | 4 | 4 |
| Illinois | 5 | 8 | 7 | 5 | 4 | 5 |
| Indiana | 4 | 8 | 7 | 4 | 2 | 2 |
| Iowa | 4 | 4 | 4 | 4 | 1 | 2 |
| Kansas | 3 | 3 | 3 | 3 | 3 | 3 |
| Kentucky | 3 | 5 | 7 | 3 | 2 | 2 |
| Louisiana | 4 | 5 | 4 | 3 | 2 | 2 |
| Maine | 2 | 3 | 3 | 3 | 2 | 3 |
| Maryland | 4 | 5 | 5 | 3 | 2 | 2 |
| Massachusetts | 10 | 10 | 10 | 9 | 7 | 8 |
| Michigan | 9 | 13 | 11 | 9 | 7 | 8 |
| Minnesota | 5 | 4 | 4 | 4 | 4 | 4 |
| Mississippi | 2 | 3 | 3 | 2 | 1 | 1 |
| Missouri | 3 | 6 | 6 | 4 | 3 | 4 |
| Montana | 3 | 4 | 3 | 3 | 3 | 3 |
| Nebraska | 4 | 4 | 4 | 2 | 1 | 1 |
| Nevada | 4 | 5 | 3 | 3 | 2 | 2 |
| New Hampshire | 1 | 5 | 5 | 4 | 3 | 3 |
| New Jersey | 3 | 5 | 5 | 2 | 3 | 3 |
| New Mexico | 4 | 5 | 4 | 4 | 4 | 4 |
| New York | 16 | 16 | 15 | 14 | 12 | 12 |
| North Carolina | 2 | 3 | 3 | 2 | 2 | 3 |
| North Dakota | 3 | 3 | 3 | 3 | 2 | 3 |
| Ohio | 12 | 15 | 14 | 10 | 8 | 9 |
| Oklahoma | 4 | 4 | 2 | 1 | 1 | 2 |
| Oregon | 11 | 10 | 10 | 6 | 5 | 5 |
| Pennsylvania | 7 | 8 | 7 | 5 | 5 | 6 |
| Rhode Island | 2 | 3 | 3 | 2 | 2 | 2 |
| South Carolina | 3 | 4 | 3 | 1 | 1 | 2 |
| South Dakota | 3 | 3 | 2 | 2 | 2 | 2 |
| Tennessee | 4 | 5 | 4 | 3 | 3 | 5 |
| Texas | 11 | 14 | 16 | 10 | 8 | 8 |
| Utah | 6 | 6 | 4 | 3 | 2 | 3 |
| Vermont | 2 | 2 | 2 | 2 | 2 | 2 |
| Virginia | 5 | 6 | 7 | 8 | 6 | 7 |
| Washington | 7 | 9 | 8 | 6 | 5 | 5 |
| West Virginia | 1 | 1 | 2 | 2 | 2 | 2 |
| Wisconsin | 13 | 15 | 16 | 15 | 11 | 12 |
| Wyoming | 2 | 2 | 1 | 1 | 1 | 1 |
| US Average | 5 | 6 | 5.6 | 4.3 | 3.5 | 4.0 |
SOURCE: Kaiser Family Foundation analysis of insurer rate filings to state regulators. NOTE: Insurers are grouped by parent company or group affiliation, which we obtained from HHS Medical Loss Ratio public use files and supplemented with additional research. | ||||||
Data were gathered from healthcare.gov and state-based exchange enrollment websites and insurer rate filings to state regulators. Companies and related subsidiaries were grouped by their parent or group affiliation using Mark Farrah Associates Health Coverage Portal TM and the Health and Human Services (HHS) Medical Loss Ratio data. Enrollment in states using Healthcare.gov is from HHS (with some adjustments made for counties without reported enrollment). In states running their own exchanges, we gathered county-level data enrollment data where possible and if unavailable estimated county level enrollment based on the state’s enrollment total. 2019 enrollment is estimated using 2018 plan selections. For most states running their own exchange, insurer participation is measured at the rating area level.